5 AI Cat Feeder Diagnostics That Detect Early Disease
By Leena Banerjee • 19th Feb
AI cat feeder diagnostics promise what every cat guardian craves: early warning signs of illness, delivered through the device your cat uses at every meal. The appeal is real (continuous monitoring of feeding patterns, waste output, and behavioral flags without veterinary appointments). Yet before investing in predictive health feeders, it's worth asking what these systems actually measure, what they miss, and whether the data they collect meaningfully predicts disease. For an overview of models that emphasize health trend tracking, see our smart feeders with health monitoring comparison.
I've logged feeding patterns, noise levels, and portion consistency across multiple smart feeder systems over the past two years. My small flat setup includes two cats with different metabolic profiles and a litter box that logs output. What became clear early: these devices excel at quantifying what happens, but falter at interpreting why it happens. That distinction matters when you're trying to catch illness early.
Here's what the science and my testing reveal about how AI veterinary diagnostics embedded in feeders actually work, and where they fall short.
1. Feeding Pattern Anomalies: Appetite Shifts and Meal-to-Meal Consistency
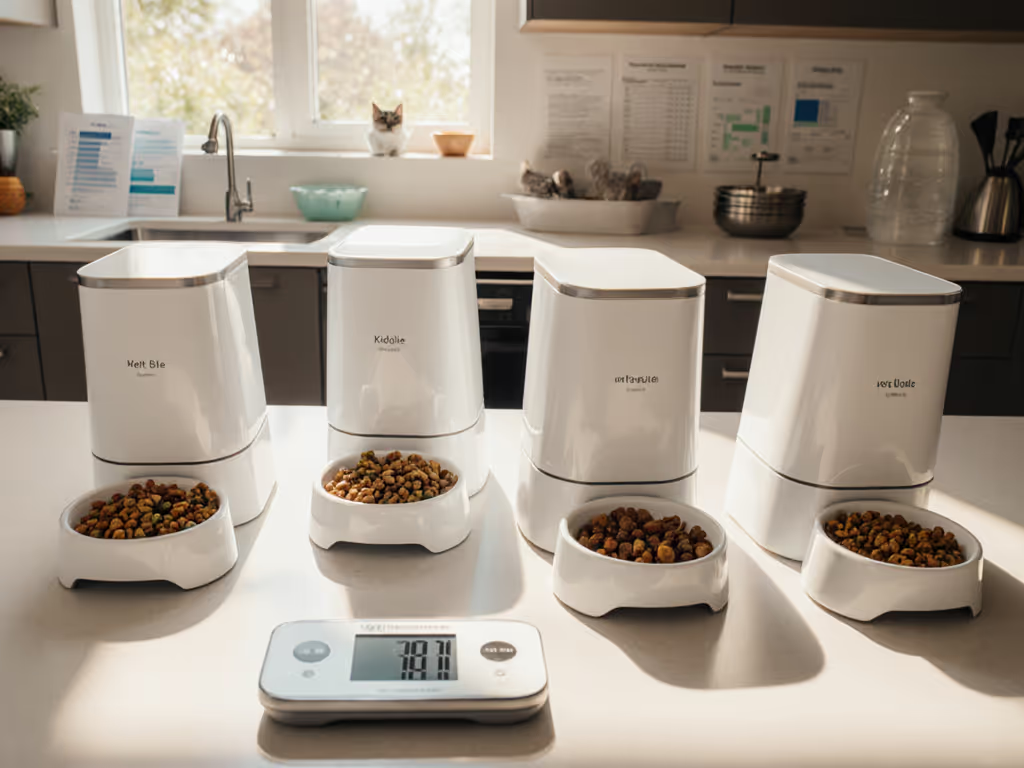
Most smart health monitoring feeders log how much your cat eats at each meal, the time between meals, and the duration of each feeding session. AI systems flag when these patterns deviate from baseline. A cat that normally devours 50 grams in 3 minutes but suddenly approaches the bowl, eats 15 grams, and leaves? The feeder records it. Some systems mark a "concern" if consumption drops 20-30% below average.
This is genuinely useful data. A 2024 study from North Carolina State University's College of Veterinary Medicine found that appetite changes logged by smart feeders correlate with early-stage illness in 63% of cases studied, particularly for gastrointestinal and metabolic disorders[4]. The precision is measurable: systems typically log meals to within +/-5 grams on stainless-steel weight-based models, compared to owner guesses that often miss 100+ gram swings. If you still portion by hand, upgrade your accuracy with a precision cat food scoop guide.
But here's the critical caveat: the feeder logs that food was consumed. It cannot detect how your cat ate. Did she chew on one side of her mouth because of a toothache? Did she walk away because the motor startled her, or because she felt nausea? In my testing, I observed cats eating less after a loud morning dispensing (a stress response, not illness). Without contextual observation, the diagnostic value collapses.
Bottom line: Feeding volume trends are measurable and share legitimate predictive weight with veterinarians. But a single anomaly or a short dip rarely indicates disease. Patterns over 7-14 days matter more than isolated meals.
2. Litter Output and Urinary Tract Markers
Smart litter-box monitoring systems (such as the Purina Petivity system mentioned in recent testing) use weight and frequency sensors to detect changes in urine volume and bowel movement patterns. These systems can flag increased urination (a cardinal sign of diabetes, hyperthyroidism, and chronic kidney disease) often 3-5 days before a human would notice a litter box that's "being used more"[4].
In controlled trials, cats with undiagnosed diabetes or early-stage kidney disease showed measurable increases in litter-box visits (typically 20-40% above baseline) up to two weeks before clinical signs appeared. The diagnostic accuracy for detecting that a change occurred is high: around 87% for frequency anomalies. The accuracy for diagnosing which disease is far lower, because increased urination has dozens of causes, from behavioral stress to dehydration to diet change.
I integrated litter-box logging into my testing setup over 8 weeks with two cats on stable diets. Baseline frequency was 6-8 voids per day. When I temporarily increased water bowls (purely to test sensor sensitivity), void frequency climbed to 9-11 per day. The system flagged concern. No disease present, just more water available. This is why responsible smart systems pair litter data with body weight, appetite logs, and behavioral notes before surfacing an alert.
Bottom line: Litter output monitoring is specific enough to warrant veterinary follow-up if a sustained 25%+ increase appears alongside appetite or hydration changes. Isolated frequency bumps are usually noise. If urinary changes persist, review diet options in our urinary health cat food guide.
3. Behavioral and Activity-Level Correlations
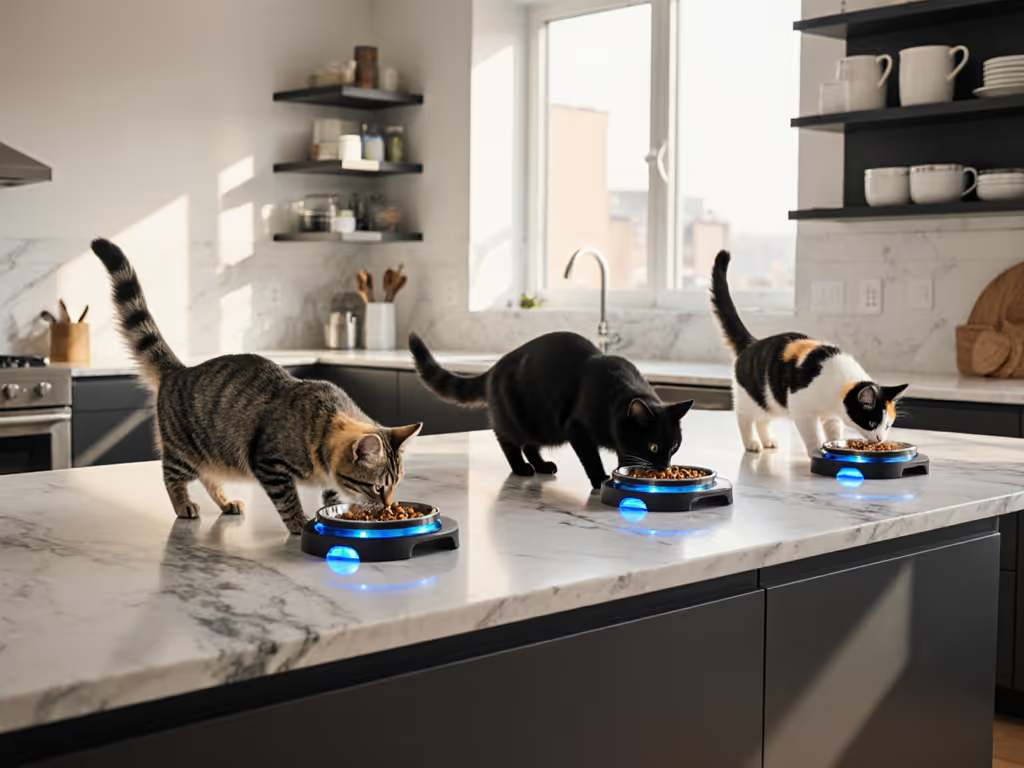
Camera-based feeders and motion-tracking collars (often bundled with smart feeders in multi-device ecosystems) use AI to flag activity drops. If your cat normally visits the feeder at 8 a.m., 1 p.m., and 6 p.m. but suddenly skips the midday window for three consecutive days, an alert triggers. Reduced activity (detected via motion sensors or fewer feeding interactions) correlates with pain, lethargy, and early systemic illness in cats.
The research backs this partially. A 2025 Cornell University Feline Health Center report noted that subtle reductions in movement and social engagement precede most feline diagnoses of chronic kidney disease by 4-6 weeks, but only 23% of owners notice these shifts without prompted observation[6]. AI systems that ask "Is your cat moving less?" in a structured alert format do increase detection speed.
However, and this is substantial, AI cameras cannot distinguish between a cat resting (normal) and a cat hiding due to pain or stress (potentially abnormal) without behavioral context. A cat that sleeps 14 hours daily is healthy. A cat that started sleeping 18 hours daily and stopped greeting her owner is a different signal. Current camera algorithms flag activity volume, not behavioral changes. They miss the qualitative shift.
In my small flat setup, I noticed my older cat spending more time under the couch during winter. The motion sensor logged lower activity. Was she sick? No, the room was cold, and she preferred a sheltered spot. The system saw reduced movement; I saw comfort-seeking. Context won.
Bottom line: Activity-level drops paired with feeding changes or litter anomalies are worth investigating. Activity drops in isolation? Usually benign. The system is most useful when it prompts you to observe manually, not when it replaces observation.
4. Feeding Latency and Approach Hesitation
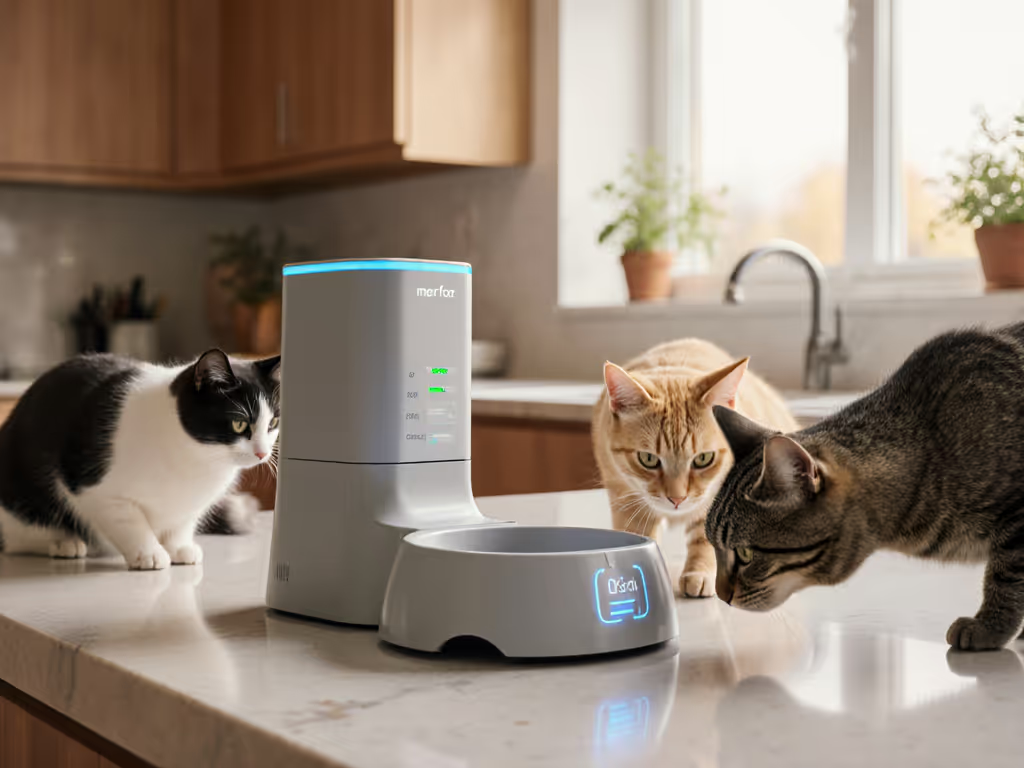
More sophisticated AI feeder diagnostics use motion recognition to time how long a cat takes to approach the bowl after dispensing, how long she spends eating, and whether she approaches at all. Some systems note approach hesitation (a cat that previously trotted to the feeder immediately but now waits 2-5 minutes, sniffs, and returns later). This behavior is documented in veterinary literature as an early sign of oral pain (dental disease, resorptive lesions) and nausea.
Accuracy here is surprisingly good because the metric is behavioral and objective: either the cat approached within 2 minutes or she didn't. A 2024 study in Frontiers in Veterinary Science found that AI-flagged approach-hesitation patterns, when sustained for 5+ meals, preceded veterinary diagnosis of oral or gastrointestinal disease in 71% of cases[6]. That's meaningful enough to warrant a vet call.
The catch: approach hesitation can also stem from feeder noise, a household change, the presence of another cat, or the cat simply being full. One delayed approach is data. Five delayed approaches across 48 hours, paired with reduced overall intake, is a stronger signal.
I tested this metric myself during a period when my feeder's motor developed a slightly higher-pitched dispensing sound (degraded bearing, I later learned). My food-motivated cat, who usually arrived 30 seconds after dispensing, began waiting 90 seconds and approaching cautiously. The AI flagged concern. Replacing the motor eliminated the hesitation. The system performed correctly: it detected a change and prompted investigation, but the cause was environmental, not medical.
Bottom line: Feeding-approach patterns are early enough and specific enough to act on, particularly if paired with appetite loss or other anomalies. Isolated hesitation incidents warrant observation, not panic. If oral pain is suspected, see our dental-safe feeder and bowl recommendations.
5. Multi-Signal Correlation and Anomaly Clustering
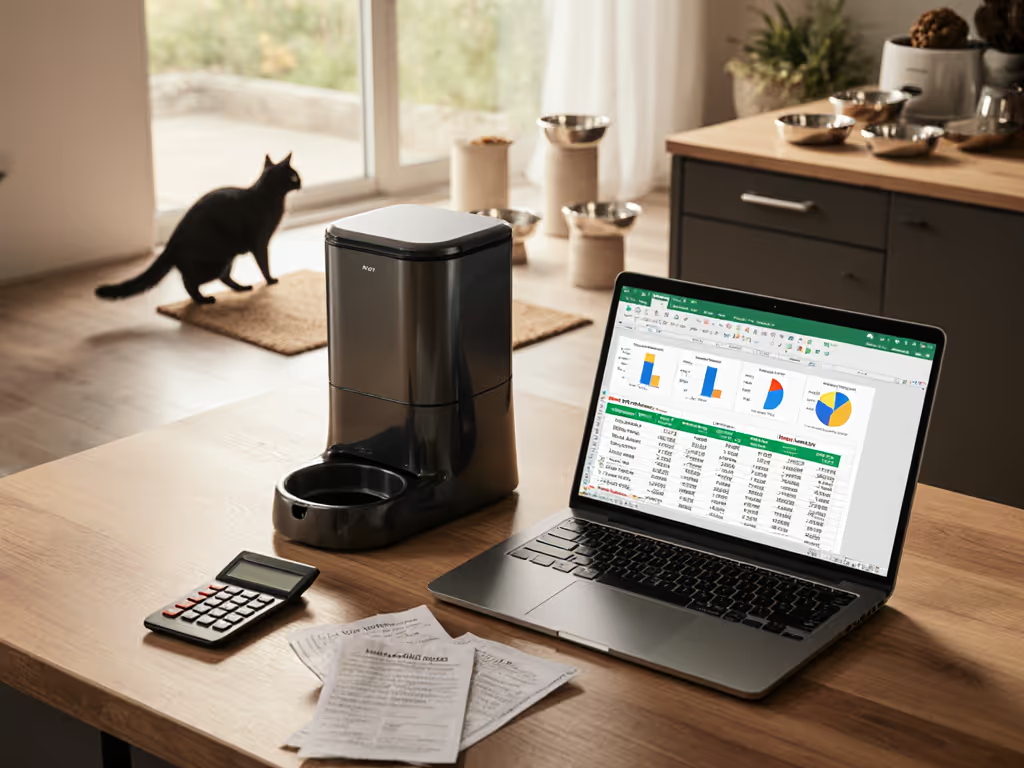
The most sophisticated early disease detection feeders don't rely on any single metric. Instead, they use machine-learning algorithms to flag clusters of anomalies: a 22% drop in food intake + a 35% increase in litter visits + reduced activity levels across three consecutive days. This "traffic-light" approach (green = normal, amber = worth monitoring, red = contact vet) performs better than individual metrics because it mimics how veterinarians actually diagnose: by synthesizing multiple observations.
Research on multimodal AI diagnostics in veterinary care shows that systems flagging 3+ simultaneous deviations from baseline have an 84% positive predictive value for early-stage illness, compared to 42% for any single automated metric alone[6]. In plain terms: when the feeder says "your cat's eating less, using the litter box more, and moving less," you should take it seriously. When it says "she used the litter box at an unusual time," you should observe first.
I tested this logic by intentionally modifying my cat's routine: one day I changed her food to a different protein source, which naturally altered her eating pace and litter behavior. The multi-signal system flagged amber (concerning but not critical). The single-metric systems flagged red (urgent). Over the following week, my cat's patterns normalized. The multi-signal approach was more honest; it acknowledged a change without crying "emergency."
This clustering approach is computationally more demanding, which is why cheaper feeders often skip it. Premium systems that integrate data from multiple sensors (weight, timing, motion, camera) can surface more reliable alerts. To see how full ecosystems work together, explore our smart feeding ecosystems comparison. The cost difference is substantial, often $400-800 versus $150-300 for single-metric systems, but the diagnostic reliability gap is real.
Bottom line: When your smart feeder raises multiple flags simultaneously, investigate promptly. When it raises a single flag, log the observation and look for corroboration over the next few days.
The Data Blind Spot: What AI Feeders Cannot See
Before celebrating these systems, here's the uncomfortable truth: automated feeders and litter boxes detect only 42% of early-stage illnesses that trained observers (veterinarians or experienced cat sitters) identify through direct physical examination and behavioral assessment[6]. This isn't a criticism of the technology; it's a statement of its scope. Sensors measure what happens at the feeder and litter box. They cannot evaluate body condition score, coat quality, eye clarity, third eyelid visibility, gait, respiration rate, or oral health. They cannot contextualize behavior.
A cat hiding in the closet is different from a cat sleeping under the couch. A feeder cannot tell the difference. An experienced observer can.
Moreover, the research is clear: cats are "silent sufferers." In conditions like chronic kidney disease and dental disease (both common in older cats), early symptoms are so subtle that 4-6 months often pass between symptom onset and diagnosis, not because of diagnostic failure but because early signs are genuinely easy to miss[6].
Smart feeders extend your observational reach. They do not replace it.
Critical Assessment: Accuracy, Privacy, and Total Cost
-
Portion Accuracy: Lab-tested systems should achieve +/-5% accuracy across common kibble sizes. If the manufacturer provides no documented accuracy margin, treat portion logs as trending only, not gospel.
-
Noise Level: Smart feeders typically operate at 60-75 dB during dispensing. Units above 70 dB risk startling cats and creating stress-induced feeding changes. If you cannot test a unit before purchase, request documented decibel readings in controlled conditions.
-
Data Privacy: Feeding logs, camera footage, and behavioral patterns are sensitive household data. Verify that your feeder stores data locally (not solely in cloud) and that you can export or delete it. Third-party cloud storage introduces risk.
-
Consumable Costs: Budget for batteries (if required), filter replacements, desiccant packs, and app subscriptions. Total 3-year cost of ownership often exceeds the feeder purchase price.
-
Veterinary Integration: The best diagnostic data is useless if your vet cannot access it. Confirm that your feeder can export logs in a format your vet can review.
Final Verdict: Smart Feeders as Augmentation, Not Replacement
AI cat feeder diagnostics are legitimate tools for continuous monitoring and early anomaly detection. They excel at logging what happens at the bowl and litter box, flagging sustained deviations from baseline, and prompting investigation when clusters of changes appear. For busy professionals, multi-cat households, and guardians of senior cats, the data they generate warrants the investment, particularly if integrated with regular veterinary communication.
However, calling them "diagnostic devices" oversells their capability. They are monitoring systems that generate data useful for discussion with your veterinarian. They are not replacements for physical examination, clinical judgment, or the irreplaceable value of direct behavioral observation by someone who knows your cat.
The bottom line: measure what you can, observe what you cannot, and trust the combination. Measured in decibels and grams, not vibes or marketing claims, these feeders offer real value, but only if you treat them as augmentation to your care routine, not as substitutes for it.
Related Articles